Supercharge your Python code with real-time performance insights
Blackfire continuously monitors and profiles your Python applications, giving you clear, actionable guidance to fix slow code and prevent future slowdowns—before users notice. Find answers and bottlenecks fast with deep insights into function calls, I/O, and async behavior—so you can ship efficient, stable code.
- Get performance tips tailored to Python frameworks like Django, Flask, FastAPI, and more
- Catch and prevent bottlenecks across async and sync code
- Focus on building, not debugging
These organizations effectively leverage Blackfire capabilities to monitor and optimize application performance:


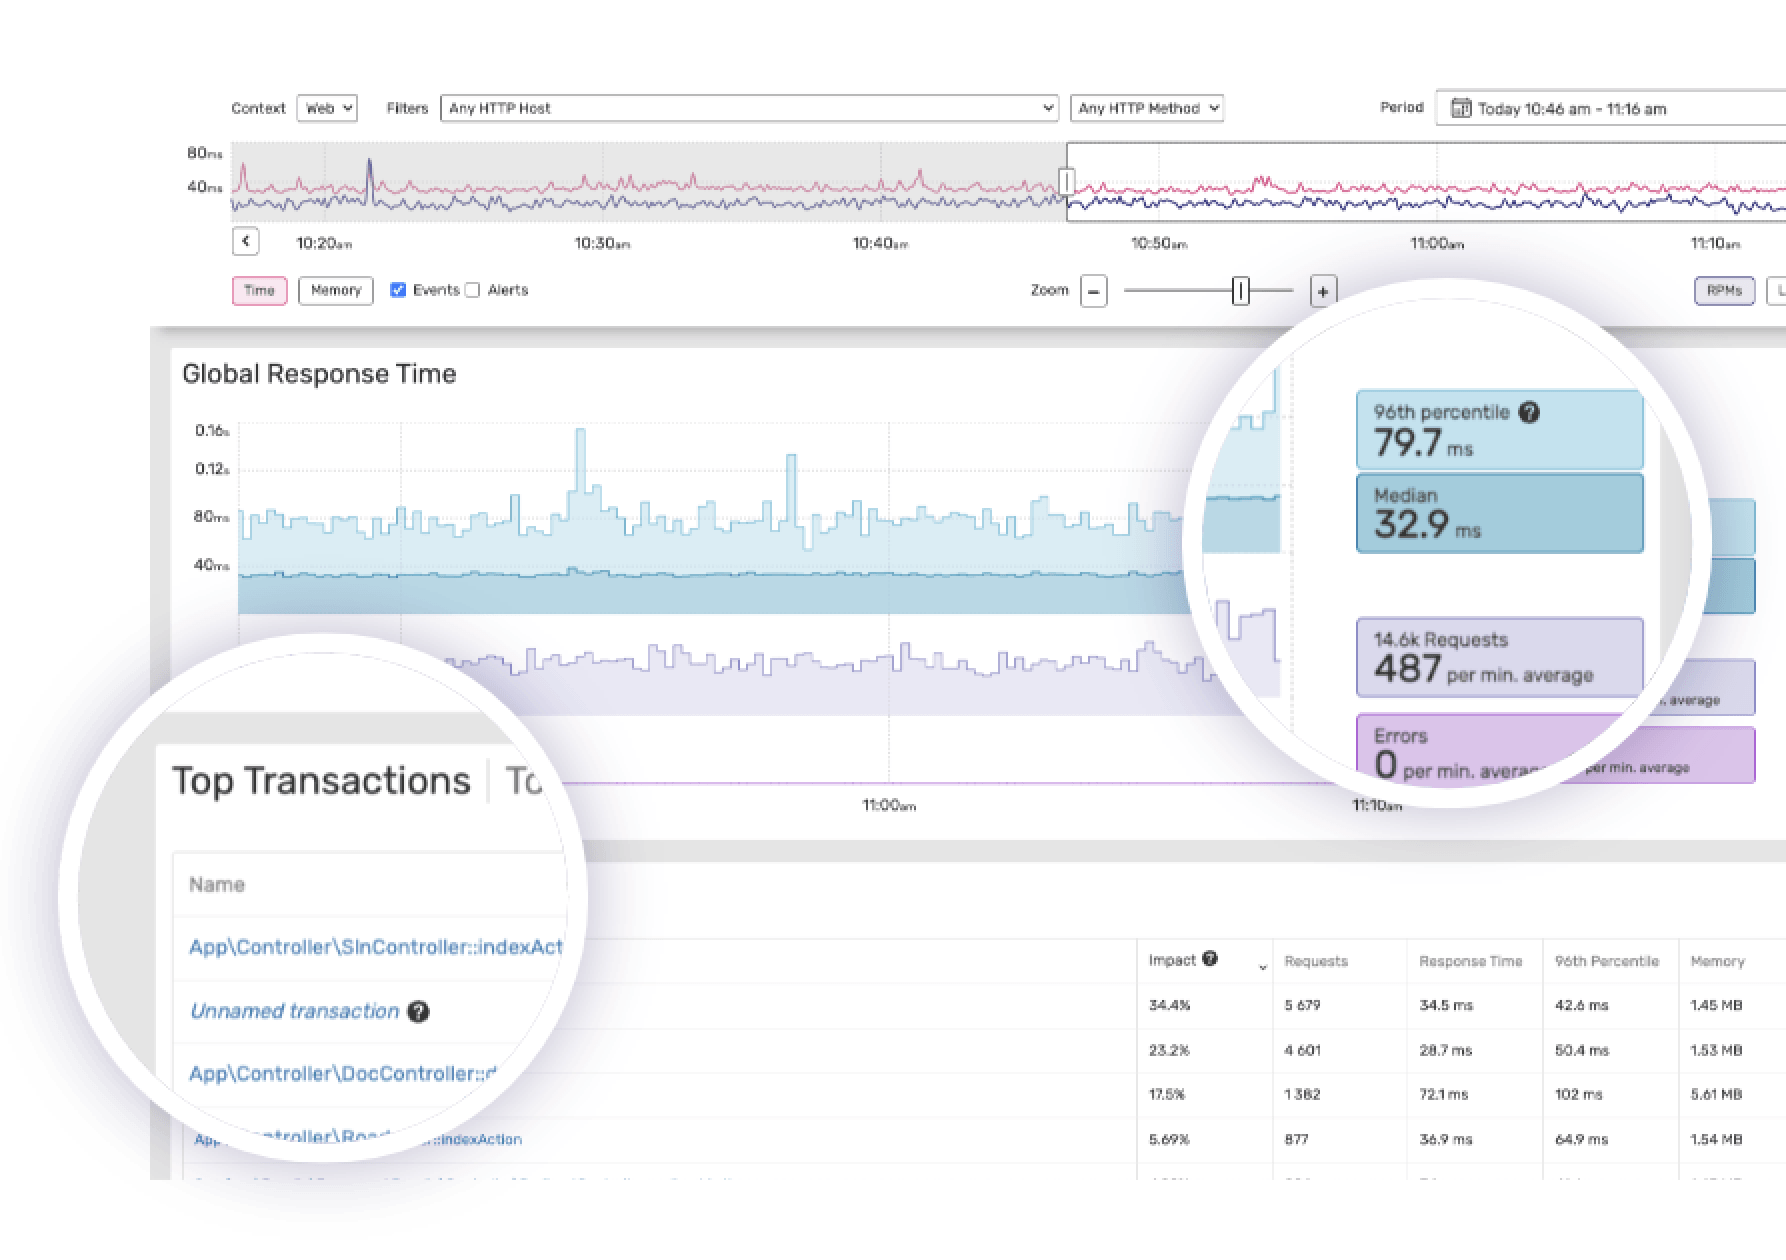
Get actionable performance insights
Get precise, data-driven insights and recommendations to enhance your app's efficiency.
Blackfire provides automated profiling and actionable guidelines, eliminating guesswork and helping teams continuously improve performance
Build resilient and crisis-free apps
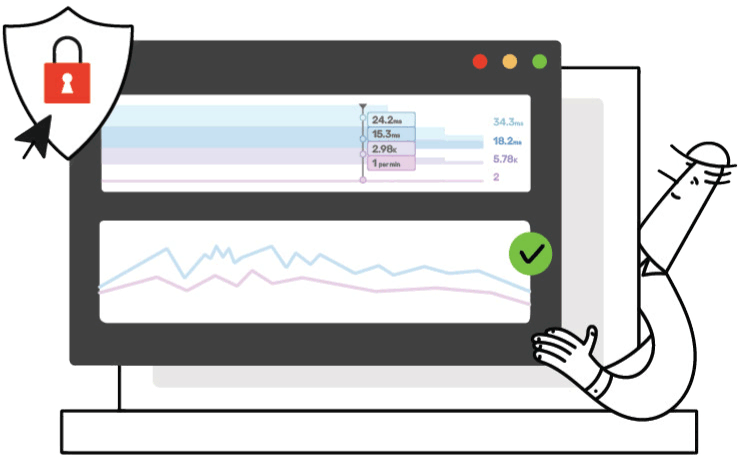
Avoid firefighting with a structured approach to performance monitoring.
Blackfire helps you detect performance risks before they escalate, empowering teams to prevent and rapidly resolve crises confidently.
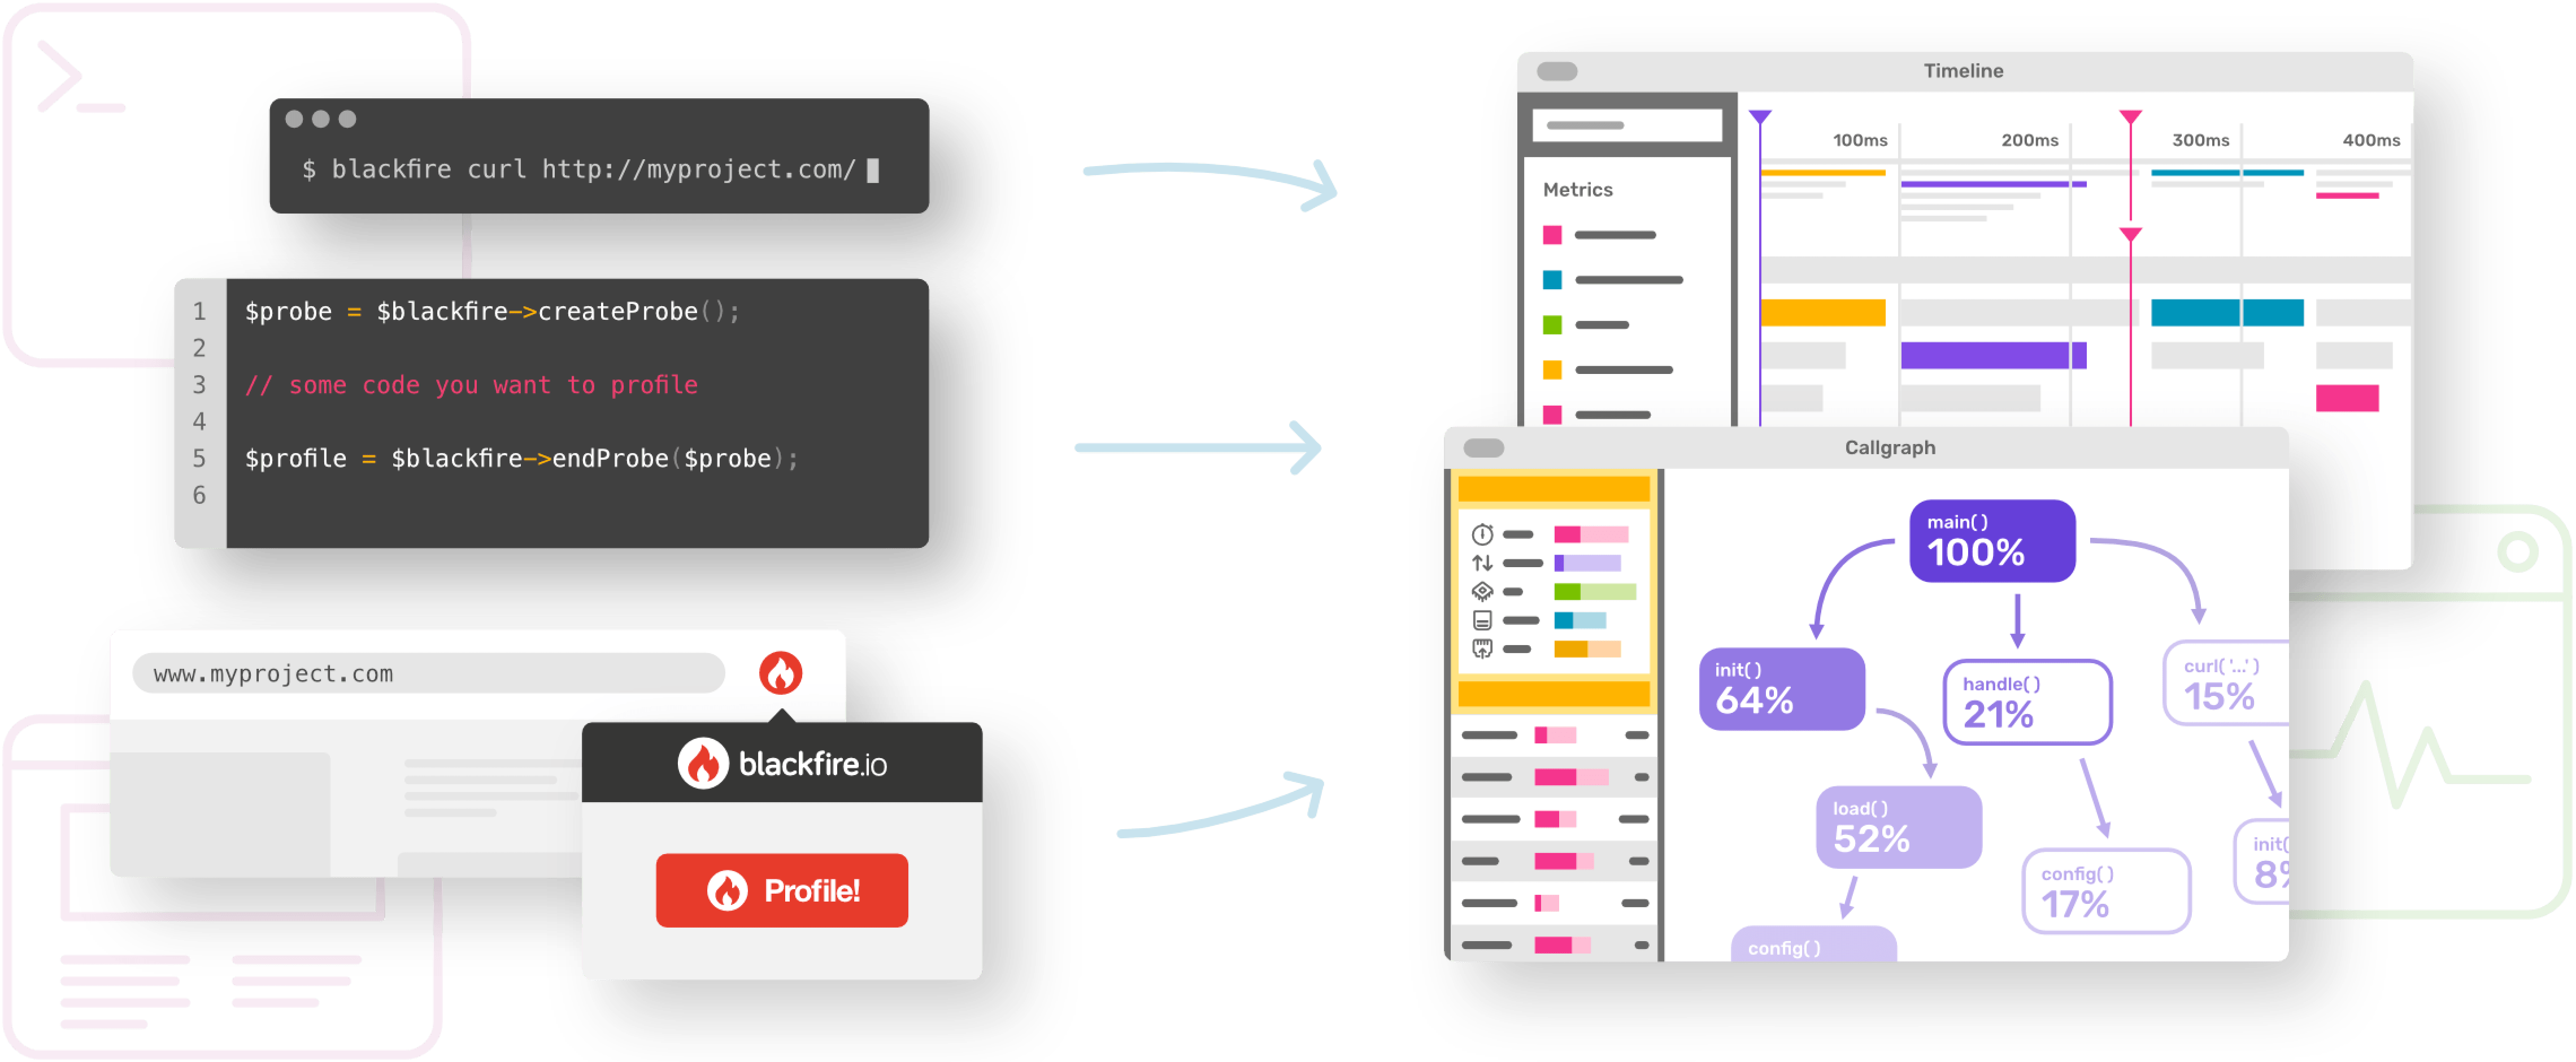
Debug smarter, build faster
Reduce debugging time and focus on delivering value to users.
With Blackfire's continuous observability, you identify and fix issues faster, freeing up time for feature development and product innovation.
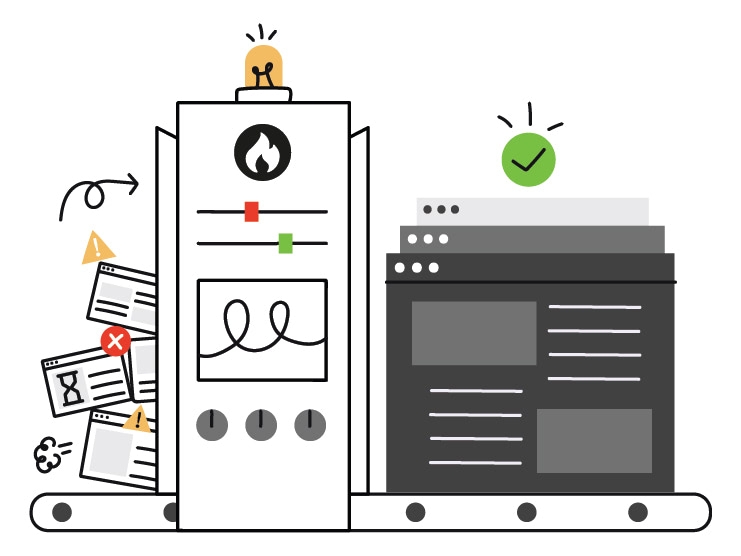
From firefighting to full control!
Speed or stability? Python teams shouldn't have to choose
Finding and fixing performance issues in Python code shouldn't feel like guesswork. But most tools lack the precision and visibility developers need.
Complex observability setups, risky production debugging, and missed regressions are all too common. And when you're shipping fast, it's even easier for hidden bottlenecks to creep in—costing time, energy, and customer trust.
As your team ships faster and builds more features, regressions slip into production unnoticed—hurting performance, user experience, and velocity.
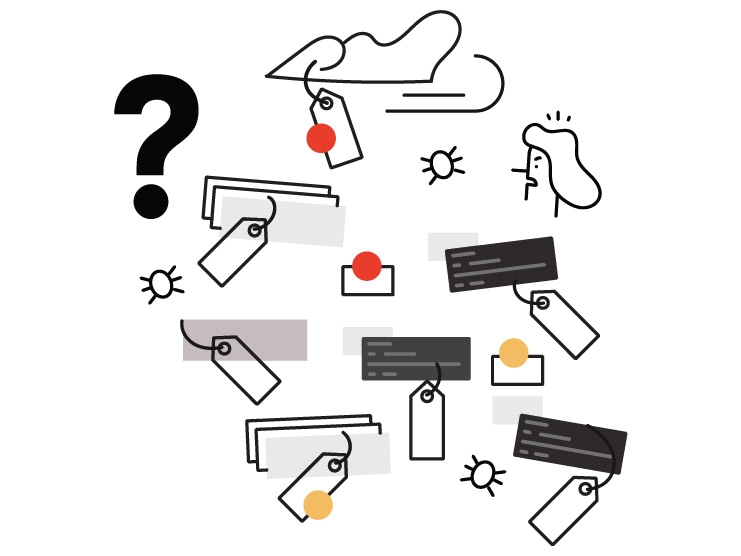
Debugging Python performance shouldn't be this hard
Fast deployments often come with a hidden cost: performance regressions that sneak past tests. When problems hit production, you're left drowning in logs, chasing ghost issues, and patching code under pressure.
Every regression risks revenue, trust, and team morale. And with no visibility, you never know if it's truly resolved.
Reclaim your Python app performance with full visibility
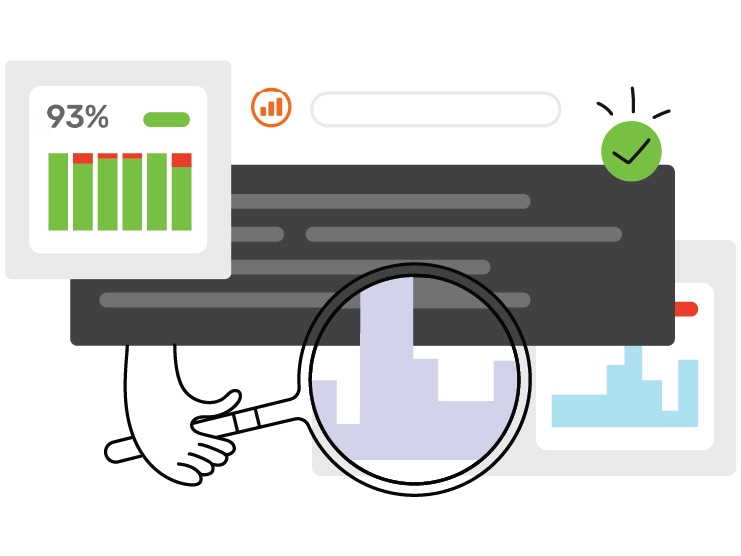
Blackfire gives you real-time insights into your Python applications—so you can spot issues early, prevent regressions, and ship with confidence.
Automatically catch performance slowdowns before they hit production. Keep your codebase lean and your users happy, even as your team deploys multiple times a day.
Performance doesn't get in your way. It moves with you; you're in control.
Here's what results our clients achieved:
3xLoad time decrease for Symfony.com
1monthFaster time to market for NKD.com
20xMore orders for GOG.com
See why developers choose Blackfire
| Procrastination (No Observability) | DIY | New Relic / Datadog | Blackfire | |
|---|---|---|---|---|
| Out of the box observability | ✗ | Complex initial setup | Moderate initial setup | Immediate, fully functional with minimal configuration |
| Observability pipelines configuration and maintenance | ✗ | Extensive manual setup | Managed for the users | Managed for the users |
| Bug discovery process speed | Slow | Moderate | Good | Fastest Automated, integrated performance discovery |
| Actionable recommendations and insights | ✗ | Limited | Good | Clear, developer-focused, highly actionable insights |
| Crisis management | Chaotic and expensive | Depends on manual setup | Real-time alerts | Proactive crisis prevention Efficient mitigation |
| Performance issues proactive detection | Reactive only | Limited | Good | Straightforward and proactive detection coupled with your CI/CD pipelines |
| Help you become a better developer | ✗ | ✗ | Moderate | Highly effective Intuitive insights for continuous improvement |
| Cost of fixing performance issues | Very high | Moderate-to-high | Moderate | Lowest Highly proactive detection prevents major costs |
| Optimize development resources and time | Constant firefighting | Limited | Moderate | Highly effective |
Built in Europe by developers, for developers.
Trusted worldwide, by teams like yours

Blackfire was born from the world of open-source software in the heart of Europe.
We saw engineering teams struggling with performance bottlenecks and drowning in observability data without answers. So we built a different kind of tool: one that delivers precise, actionable insights, helping developers stay in control of their applications, without the noise.
Today, Blackfire is the leading Web Observability solution in Europe for decoupled PHP and Python applications — trusted by over 1,000 engineering teams worldwide.
In 2021, we joined forces with Platform.sh, expanding our mission to provide 360° actionable observability. Together, we empower developers with the tools they need to build, scale, and optimize their applications confidently — with performance as a feature, not an afterthought.
How to optimize speed, stability, and efficiency?
- Monitor & analyze performance:
- Install and configure Blackfire.
- Enable Monitoring and Continuous Profiling on your production environment.
- Blackfire collects insights on your application's real behavior.
- You can now identify improvement opportunities and pinpoint when and where issues occur.
- Identify root causes:
- Use Blackfire's deterministic profiling to probe the root cause of issues down to the function or service call level.
- With this visibility, you can understand why performance bottlenecks occur and take informed actions to optimize them.
- Future-proof your app:
- Compare versions and performance before deploying a new version.
- Write performance tests to ensure that your improvements remain intact over time.
- Automate performance testing:
- Automate performance tests with Synthetic Monitoring.
- Integrate them into your CI/CD pipeline to prevent performance regressions before they reach production.

“ Blackfire's continuous observability solution is empowering. Our teams can make early discoveries with the monitoring. Improvements in the code are based on the precise and detailed information collected while profiling parts of the applications. Then, by writing efficient performance tests and plugging them with our CI/CD pipeline, we avoid regressions of already-known performance issues. ”
Marcin Czarnecki
Backend Chapter Lead at GOG.com and Tech Lead for GOG Store
Choose the best plan for your needs
Production plan
Enjoy the most of what Blackfire.io offers with this plan for companies that need to monitor a lot of data.
Included
- Profiling
- Performance Monitoring
- Continuous Profiling
- Alerting
- Continuous Testing
- Integrations
- Manual Assertions
- 3UsersAdd more for €24.92/month each
- 1EnvironmentAdd more for €58.25/month each
- 1 MillionMonitoring TracesAdd more for €41.67/month each 1M
- 5GBContinuous ProfilingAdd more for €10/month each 1GB
- 1 MillionFront-end ObservabilityAdd more for €41.67/month each 1M
Development plan
This plan is our low-cost alternative that lets you fine-tune your application until it’s ready to go to production.
Included
- Profiling
- Manual assertions
- 1UserAdd more for €33.25/month each
Upsun integration
If your current plan doesn't cut it or you just need more to work with, then check out how you can host your applications on Upsun.
Full access to Blackfire is bundled with all PHP and Python Upsun projects and works integrally with the Upsun workflow.
Contact us for more information.
Frequently Asked Questions
Which payment methods do you accept?
Payments are managed by Recurly, which accepts most credit cards and SEPA payment for European customers. We also accept money transfers for yearly Production subscriptions - contact us if you're interested.
What if I don't have Euros or US Dollars?
Provided you have an international card (Visa, MasterCard, etc.), your bank will make the conversion for you.
Are taxes included in the prices above?
Prices are excluding taxes. In some cases, VAT may be added to your bill and the total amount charged, according to your country of residence's VAT rate on digital products and services.
How to convince my boss to invest in Blackfire?
Investing in application performance isn't just a technical concern—it's a business imperative. Blackfire helps companies optimize their web apps, reducing debugging time, cutting infrastructure costs, and improving user experience.
We've prepared a helpful guide explaining the business impact of Blackfire and how to communicate its value effectively to your leadership.
Can I upgrade or downgrade my Plan, or add or remove add-ons?
Any transition to a lower-cost plan or the removal of an add-on will become effective at the conclusion of the ongoing billing period. Conversely, up- grades or the inclusion of add-ons take effect immediately. In the case of adding an add-on, the subscription fee will be prorated and adjusted to syn- chronize with the billing period and schedule of the underlying plan.
Can I switch from a monthly to a yearly billing schedule?
You have the option to transition from a monthly billing schedule to a yearly billing schedule at your discretion. In the event of such a shift, Platform.sh will reimburse the prepaid monthly fee, prorated based on the date of the change, and subsequently bill for a full year of services. Switching from yearly billing to monthly billing can only be done on the anniversary date at the end of the current yearly billing period.
Optimize your Python apps with performance insights
Blackfire gives Python developers like you the tools to find slow code, improve execution speed, and prevent performance regressions—across any stack or environment..
Join thousands of Python developers using Blackfire to keep their async and decoupled applications fast, scalable, and production-ready.
